Polar Graphing
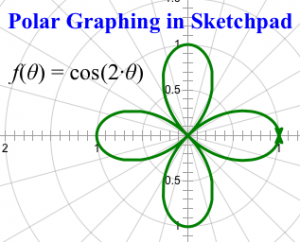
Using Sketchpad, it is very easy to start from scratch and create a polar graph. Here are the steps to create the graph shown on the right below.
- Choose Graph | Plot New Function.
- Use the Equation menu to choose r = f(θ).
- Type “c” (for “cos”), “2”, and “th” (for “theta”).
- Click OK.
- If your angle units are degrees, Sketchpad may ask if you want to change to radians. (Don’t worry; the graph will be correct no matter whether you want to use radians or degrees.)
That’s it!
This short video shows how easy it is to add parameters to control the amplitude, period, and phase shift:
It’s also easy to create a family of polar functions. Once you’ve modified your graph to show f(θ) = a·sin(b·(θ – c)), here are the steps used to graph the family of functions shown below.
- Select both the graph and parameter a.
- Choose Construct | Family of Functions.
- Set the domain to go from 1 to 6, and the number of samples to 11. This will create samples for these values of a: {1.0, 1.5, 2.0, …, 6.0}.
- Click OK.
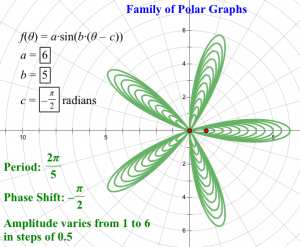
You’re done. Now experiment on your own!