In my previous post, I presented an interactive Web Sketchpad model for visualizing and solving fraction multiplication problems. This week, I’d like to back up a step and focus on the more fundamental skill of visualizing and reasoning about the size of fractions.
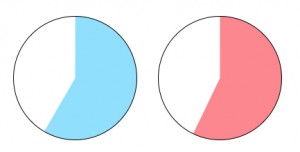
The fraction game below (and here) presents two random fractions at a time and challenges students to match the fractions to their corresponding area representations. The fractions are shown as parts of a circle, but the divisions of the circle are hidden.
There are four different games, and you can navigate from game to game by using the arrows in the lower-right corner of the model. The first game always presents the two circle sectors in the same vertical orientation, making it easier to compare them. You can also drag one circle onto the other. The remaining three games position the two sectors randomly, adding to the challenge. In the first three games, the denominator of the fraction is less than or equal to 12. In the final game, the denominator is less than or equal to 20.
The first two games include a hint button that when pressed, reveals an additional circle divided into equal parts. Dragging the “split” point clockwise divides the circle into more equal parts and counterclockwise into fewer parts. The circle can be dragged onto either of the other circles to help match them to the fractions.
Below are six examples of the types of reasoning that students may use in solving the fraction identification challenges. There are, of course, multiple ways to think about each problem.
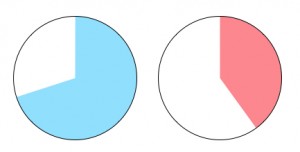
Example A: Match 7/10 and 4/10 to the circles. Since both fractions share the same denominator, the numerators are enough to identify the larger fraction.
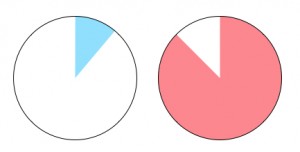
Example B: Match 1/9 and 7/8 to the circles. The visual representation of the two fractions highlights that one is near 0, and the other near 1, pointing the way to identifying them.
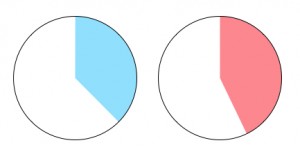
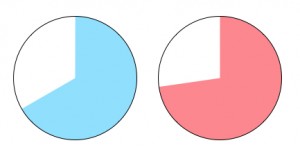
Example C: Match 3/7 and 3/8 to the circles. This example addresses a common misconception that as the denominator of a fraction grows larger, the fraction itself grows larger as well.
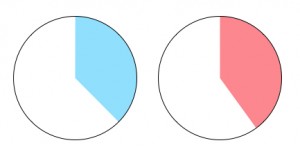
Example D: Match 3/8 and 4/10 to the circles. The visual representation of the two fractions highlights that both are near one half. Of the two fractions, 4/10 is closer to one half.
Example E: Match 4/7 and 7/12 to the circles. These two fractions are so close in value that finding a common denominator is the only reasonable solution path (other than using the Hint button).
Example F: Match 2/3 and 8/11 to the circles. These two fractions are also close, but rather than find a common denominator, students may be able to identify 2/3 visually.
An annotated list of all our elementary-themed blog posts is here.
With regards to fractions, it is always tricky to deal with it. Thankfully your site gives me another way to solve it accurately.