The Broken Stick Puzzle
Several weeks ago, my friend Martin shared the following probability puzzle with me: Two points are chosen independently and at a random on a stick. The stick is broken at those points to form three smaller sticks. What is the probability these three sticks can form a triangle?
This is a classic problem, dating back to an 1854 examination at Cambridge University.
As I considered how to solve the puzzle, I recalled a related probability challenge, Wait for a Date, that I featured in this blog last year: Two friends arrange for a lunch date between 12:00 and 1:00. A week later, however, neither of them remembers the exact meeting time. As a result, each person arrives at a random time between 12:00 and 1:00 and waits exactly 10 minutes for the other person. When the 10 minutes have passed, each person leaves if the other person has not come. What is the probability the friends will meet?
In both puzzles, there are two pieces of information: the two locations where the stick is broken or the times when the two friends arrive. Based on the information, the sticks either do or do not form a triangle, and the friends either do or do not cross paths.
In Wait for a Date, I represented the two arrival times as a single point in the plane, with the x– and y-coordinates indicating the two times. Doing so allowed me to run a simulation where I randomly varied the two coordinates and colored the resulting points either red or green, depending on whether the two friends met. I suspected that this geometric approach would work equally well with the broken stick puzzle.
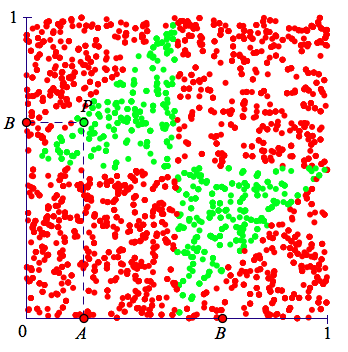
Below is my Web Sketchpad model. The stick is represented by the interval from 0 to 1 on the x-axis, and points A and B represent the locations where the stick is broken. Point B is displayed on the y-axis as well, allowing me to plot a single point, P, whose x-coordinate is the location of the break at point A and whose y-coordinate is the location of the break at point B. Press Run Simulation Once several times. Notice that the point P is green when the three broken sticks can form a triangle and red otherwise. Now, press Run Simulation Repeatedly and watch as the screen fills with green and red points. What is the probability that the broken sticks form a triangle?
As the image below suggests, the probability of making a triangle is 1/4.
 I enjoyed watching Sketchpad create this picture, and now wanted a way to understand why certain regions were red and others were green. I started with the all-red square regions in the lower-left and upper-right corners. I dragged points A and B so that point P sat in one of these regions and examined the situation. Visually, it was clear that breaking the stick at A and B resulted in two smaller sticks whose sum was less than 1/2. Since the remaining third stick was greater than 1/2, the triangle inequality tells us that no triangle is possible.
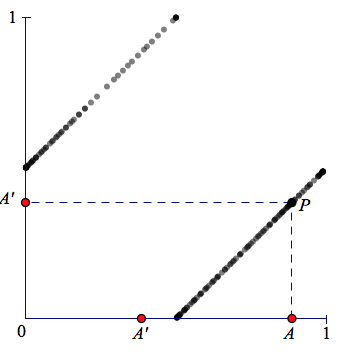
I then turned my attention to the the shared hypotenuses of the red and green right triangles. What was true about the stick lengths when point P sat on a hypotenuse? I suspected that at these locations, one stick was exactly equal to 1/2, meaning that the remaining two sticks summed to 1/2 as well. To check my conjecture, I altered my model slightly. To view the new model, press the arrow in the lower-right corner of the websketch. Now, when you drag point A, you’ll see that point A’ is always exactly a distance of 1/2 away. Thus we can see all the possible stick breaks that result in one stick having a length of 1/2. Dragging point A back and forth between 0 and 1 reveals that my hunch was correct—point (A, A’) traces the two hypotenuses separating the red and green regions.
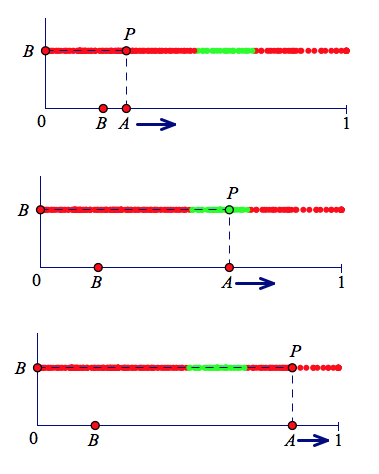
Digging deeper into the model, I picked a random spot for point B, left it in place, and dragged point A back and forth along the x-axis. This traced a single “slice” of successes and failures and allowed me to make intuitive sense of the situation.
The picture below shows an example of this strategy (Try it yourself on the first page of the websketch.) In the uppermost image, points A and B are to the left of 1/2 so as I described above, they form two sticks whose sum is less than 1/2. No good! In the middle image, point A is to the right of 1/2 and the distance between A and B is less than 1/2. In this case, AB is clearly less than the sum of the other two sticks and the sum of AB with either of the other two sticks is greater than the remaining stick. We have a triangle! In the remaining image, the distance between A and B is greater than a 1/2 so no triangle can be formed.
I’ll leave you with two variations of the broken stick puzzle:
- Suppose point A is chosen first, at random, and the stick is broken at this location. Point B is then chosen at random from the longer of the two resulting sticks. What is the probability these three sticks form a triangle? You can run a simulation of this problem on the third page of the websketch above.
- Suppose point A is chosen first, at random, and the stick is broken at this location. One of the two resulting sticks is then chosen at random and split at a random location. What is the probability these three sticks form a triangle? This may sound the same as the original problem, but it isn’t! You can read more about this variant, as well as very clever alternative solution to the original puzzle, in this Martin Gardner column.