In this guest post, Nate Burchell describes a sketch he uses with his students to explore parametric functions. In this process students work entirely in a graphical world, manipulating graphs directly rather than by way of equations. (Nate teaches in Seoul, Korea, where I enjoyed his family’s hospitality when I attended ICME in 2012. His blog has many wonderful Sketchpad resources.)
— Guest post by Nate Burchell
I have been playing around with an idea in Sketchpad which I have been calling a “tactile function.” It is a function defined by independent points, points that the user can move to make the function respond. Drag the light-blue points in the graph below to see what this feels like. (Drag t on the x-axis to change the independent variable.)
You define a tactile function not by writing an equation, but by grabbing the graph and shaping it. Functions are usually considered to be symbolic ideas that have graphical representations. What if instead we designed the graph directly and let the equation be what it may?
(This process reminds me of the Doing-Undoing habit of mind that Mark Driscoll describes in Fostering Algebraic Thinking. If we change our perspective to flip an idea around, we might encounter good math and interesting connections.)
Math teachers define functions by their graphs every time they scribble a curve on the board. If I want to show an increasing function whose graph changes concavity twice, I just draw a curve with those characteristics. It would be a lot more trouble, and less enlightening for students, to figure out an equation that has the desired features.
An example I draw with chalk or marker has limitations: It’s strictly graphical, I can’t get accurate numeric information from it, and I can’t easily change its shape. But Sketchpad allows me to construct a function that’s mathematically well-defined and easy to modify.
Recently my calculus students were studying parametric curves. The graphs in this topic are difficult for students to produce and comprehend, and I realized that we could explore this topic through tactile functions.
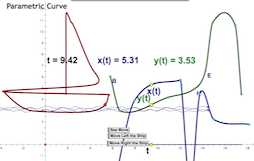
In this sketch, two functions of t determine x and y coordinates of a point, located at (x(t), y(t)). The path of that point defines the parametric curve on the left. Drag t and observe how the values of x(t) and y(t) control the location of the red point on the left as it traces out the parametric curve defined by the blue and green graphs.
Use the page navigation arrows in the lower-right corner of the websketch to see examples of the parametric curves you can make by adjusting functions x(t) and y(t).

To make your own design, redefine the x(t) and y(t) functions by dragging the 8 points that determine each of them. Try to make a pretzel, a circle, a star, or your favorite letter. On the right is a sailboat one of my students made.
In this video I give some hints:
You can download my original sketch for use with The Geometer’s Sketchpad, version 5.