Function Machines: Building Algebra Out of Arithmetic
Function machines have long been a fixture of elementary and middle-school mathematics. Typically, the teacher enters an expression into a machine (for example f(x) = 3x + 2), hides the expression, and then runs the machine with a variety of inputs, with each yielding a single output. By examining the input-output pairs, students determine the rule that transforms inputs into outputs. It’s a great activity, but only begins to hint at the power of the machine metaphor.
Function Machines is a free web app I’ve built that takes this familiar lesson in a new direction. Rather than working with one machine and its hidden rule, students build networks of interconnected machines, keeping everything visible. The goal is to use the machine metaphor to make connections between computations, order of operations, and algebraic notation.
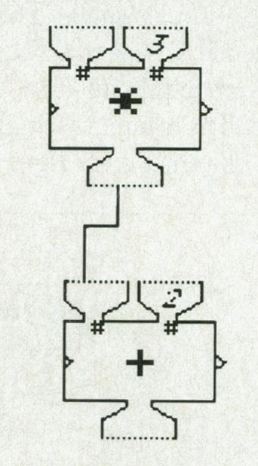
My app was inspired by a software program of the same name developed by Wallace Feurzeig and Paul Goldenberg in the 1990s. In their design, numbers flow into and through machines, with one or more inputs transforming into an output that then feeds into another machine as its input. Below is an image from Feurzeig and Goldenberg’s program showing a ‘multiply by 3’ machine connected to an ‘add 2’ machine.
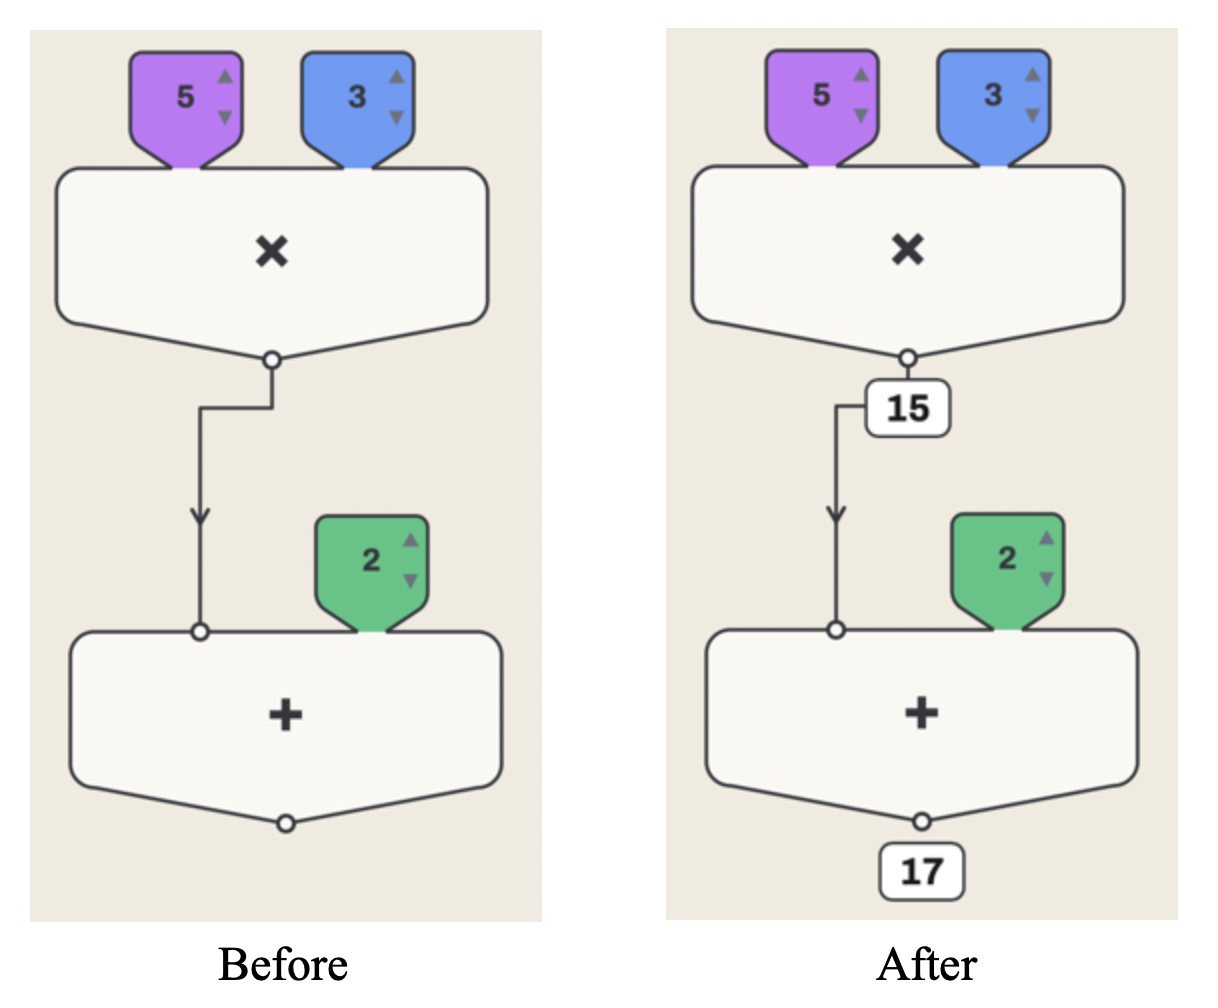
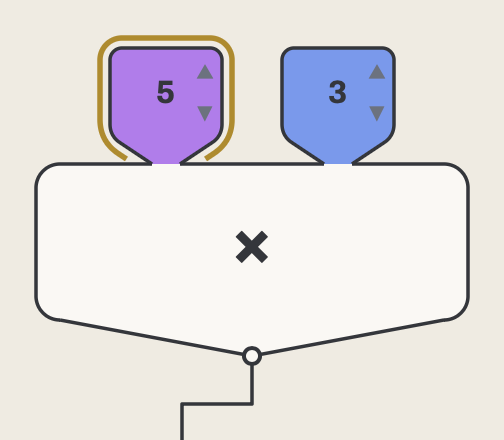
My version of this same machine network is below, and a short YouTube tutorial of the app in action is here (a longer overview is here.) In the Before image, students have entered 5 as an input. Pressing an Evaluate button begins the action, with the multiplication machine briefly displaying 5 × 3 in its interior and a 15 appearing as the output. The 15 then travels along the wire into the addition machine, which displays 15 + 2 in its interior. Finally, a 17 emerges. Notice that in the After stage, with the computations complete, the 15 is still visible, allowing students to see the intermediate output (and making a nice connection to function composition).
A Bridge to Notation
Hovering over a machine displays the computation associated with it. In the above example, those computations are 5 × 3 and (5 × 3) + 2. Note that students don’t need to know how to write (5 × 3) + 2 with parentheses before doing the mathematics. The expression grows naturally out of what they build, with the structure of the machines guaranteeing that multiplication happens first. Viewed this way, order of operations is less an arbitrary convention than a way of notating the structure of a computation.
Sending Data to a Table
Some or all of the data that passes through a network of machines—the inputs, the intermediate output(s), and the final output(s)—can be collected in a table that sits alongside the machines. Students pick from a list showing all the possible inputs and outputs that can be displayed as column headers. Below left is the list of column options for the f(x) = 3x + 2 function displayed above, and below right is the corresponding table showing the result of including all possible columns. Note that the order of the columns is automatically determined by the computational order of the inputs and outputs. Also observe that the names of the columns match the specific computations associated with an input of 5.
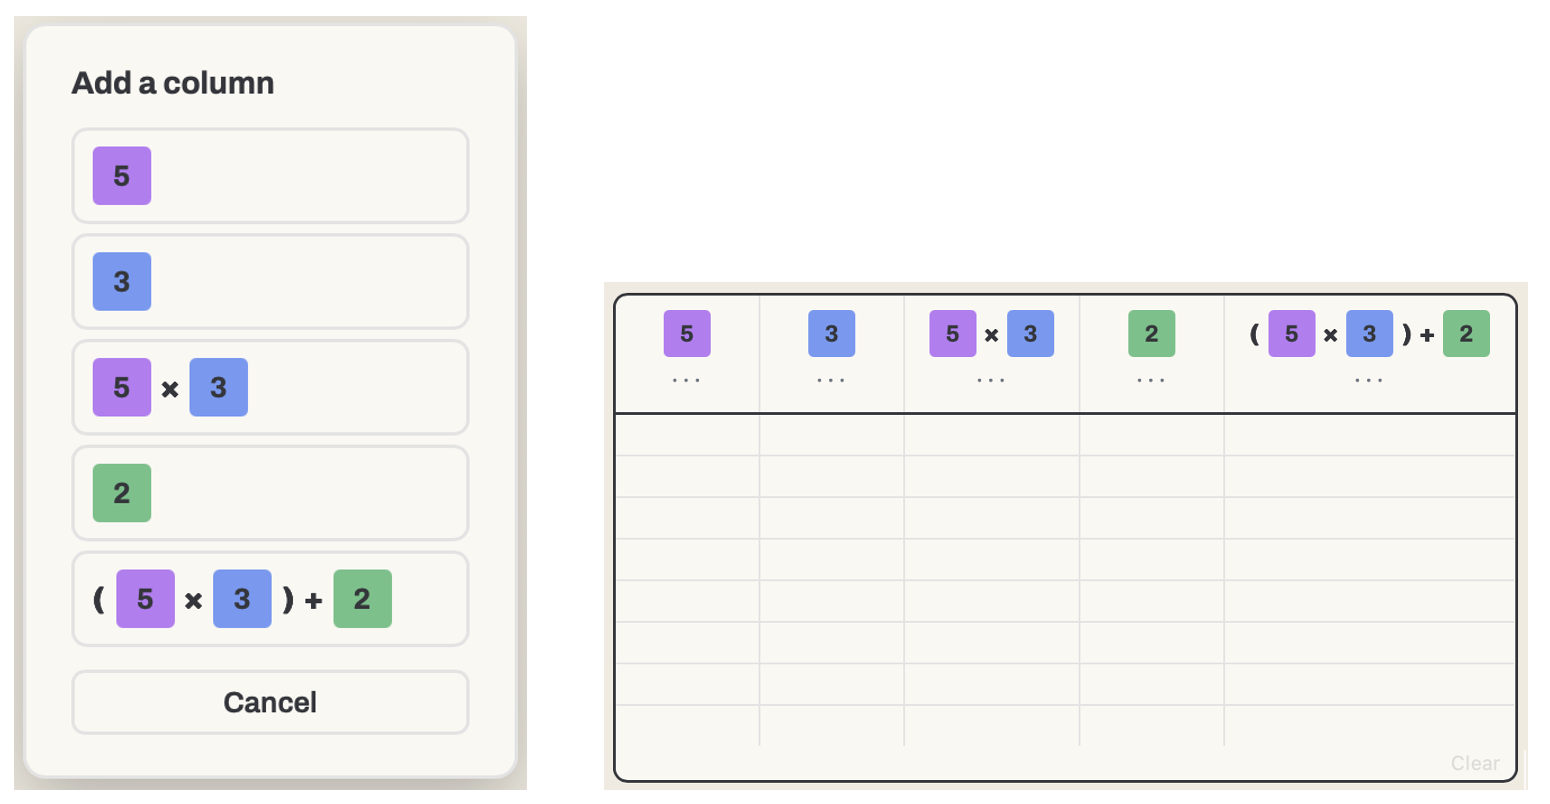
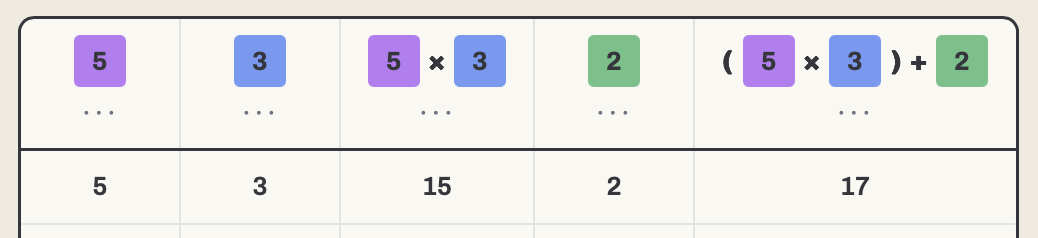
With the table now ready, students press Evaluate. As the network of machines awakens, the inputs and outputs travel along temporary wires to the table as they become ready. The order in which the numerical entries of a row are filled is a picture of mathematical dependency, with the sequence and timing of the animation playing a role in the mathematical representation. As a concrete example, for the machine network above (f(x) = 3x + 2 with an input of 5), students would see the following:
- The inputs of the multiplication machine, 5 and 3, head to the table immediately.
- The product, 15, follows as soon as the multiplication machine outputs it.
- The 2 waits. It sets off only when the 15 reaches the addition machine.
- The final output, 17, arrives last, because it depends on everything before it.
I encourage you to watch the YouTube tutorial to see the dance of the numbers, both through the machines and to the table.
Setting the Pace
Three controls determine how a computation unfolds. Step moves the computation forward one stage at a time. Values travel through just one machine and stop after a function produces its output, giving the class time to talk about what they observed and predict what will happen next. Evaluate runs the whole network through once, from its inputs to its final outputs. Finally, Evaluate + Advance runs the network repeatedly, each time incrementing a chosen input by 1 (for integer inputs). A gold ring marks the input that’s advancing, so it’s always clear which input is driving the data. In the f(x) = 3x + 2 example from above, students can designate 5 as the input to be auto-incremented and run the machine repeatedly with inputs of 5, 6, 7, … and so on. Evaluate + Advance makes it easy to collect lots of table data without needing to change the input manually.
Colors Represent Variables
The table offers a bridge to algebra. When the student changes the input of 5 to other values and records multiple rows of table data, the 5 drops out of the column header, leaving only the purple square (see below). Purple no longer names the number 5; it names the quantity the purple input represents, whatever its current value happens to be. The color has become a variable.
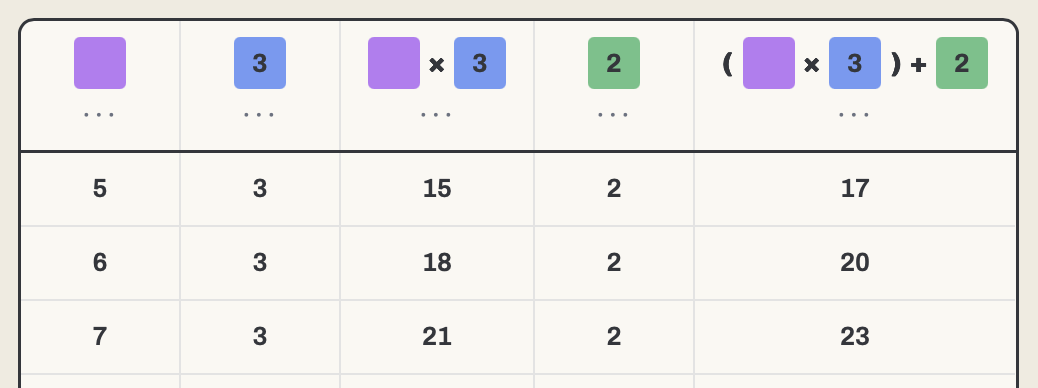
From here, the step to using a letter to represent a variable is short. The space below the colored-square representations is reserved for algebraic notation. A teacher can label the purple square input column as x, and the purple square and the letter are plainly doing the same job. Students can then name the other table headings as shown below. In this manner, rather than the variable being imposed as new notation, the need for it grows out of the student’s own activity. Students also meet the variable first as a changing quantity rather than as an unknown to be solved for.

Two Expressions with a Common Output
All of these features of the app come together in the network below that takes a single input and simultaneously transforms it into two outputs along two separate chains of computations. The first chain multiplies the input of 4 by 2 and then adds 6 to the result. The second chain adds 3 to the input of 4 and then multiplies the result by 2. Surprisingly, both outputs are the same.
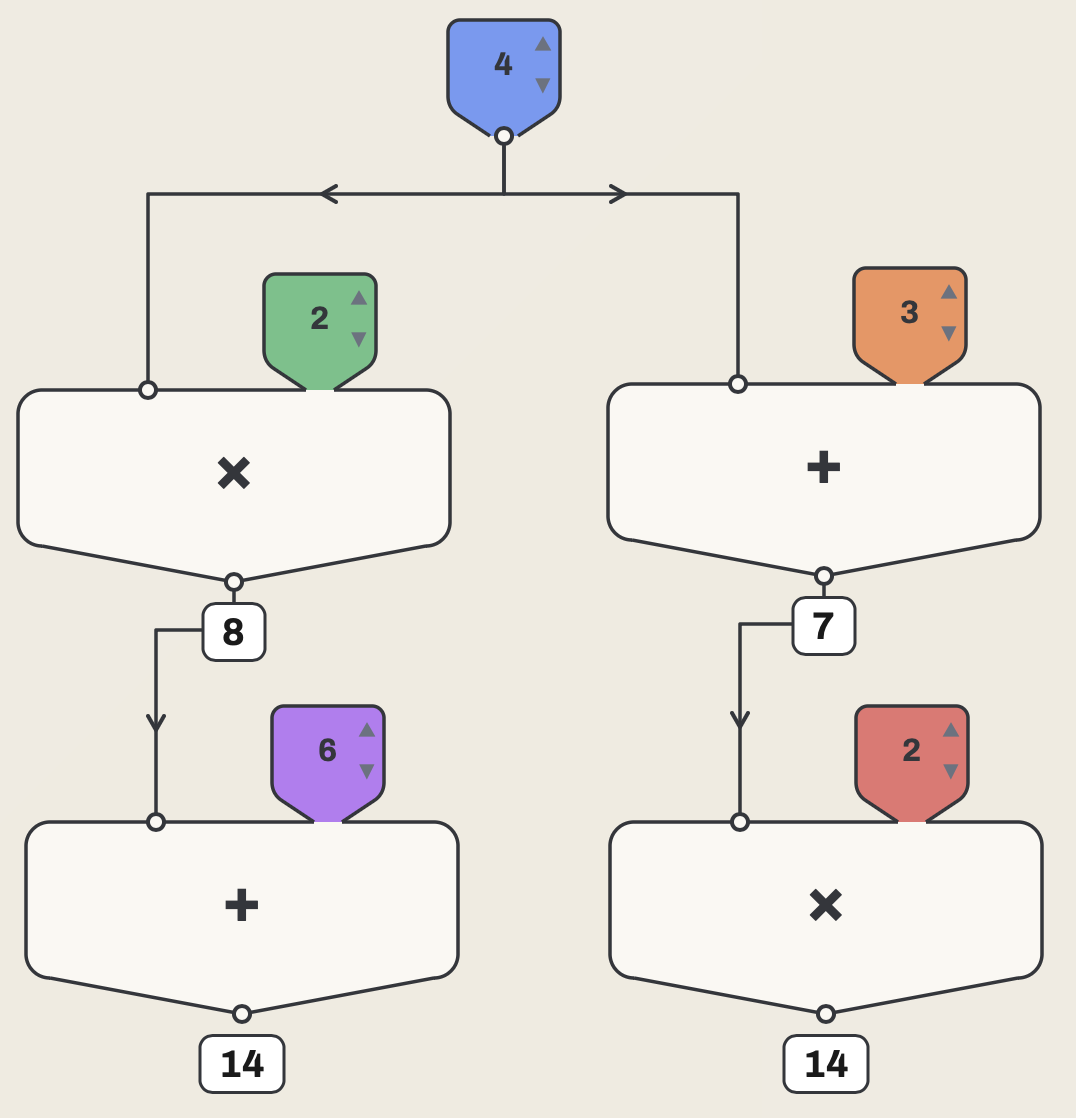
One value agreeing could be a coincidence, so students collect more data in their table, using Evaluate + Advance to generate multiple rows easily.
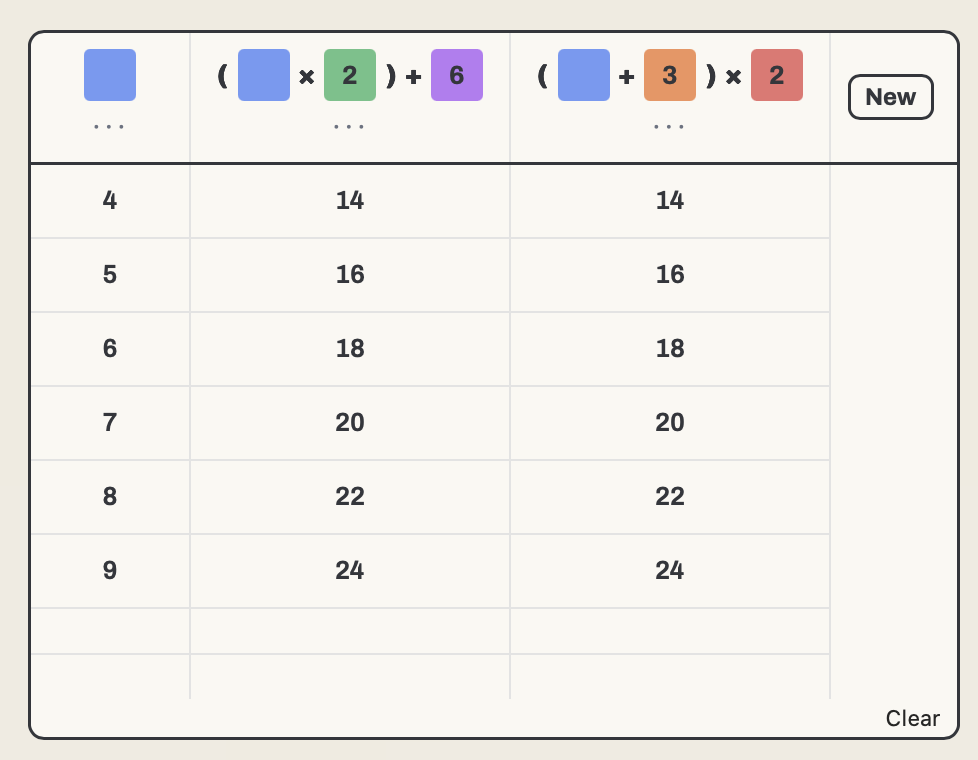
The rows provide compelling evidence that the two chains of computations are equivalent, and the class now turns to the algebra to explain why. The network itself hints at why: in the second chain, the multiplication machine receives the entire sum, so the 3 gets doubled along with the input, which is exactly why the first chain must add 6 rather than 3. The class can confirm this with algebra, replacing the blue square in the headings with x and then use the distributive and commutative properties to rewrite (x + 3) × 2 as 2x + 6.

Three Representations
As illustrated throughout this post, my Function Machines app provides three representations that do complementary work:
- The machine network provides a visual display of how inputs are transformed into outputs.
- The expressions that appear when hovering over a machine or when viewing the table headers represent the machine computations symbolically.
- The table provides a record of what happens as inputs vary, while the order in which the values arrive to the table makes mathematical dependency visible.
Each of these representations makes something mathematically salient that the others leave in the background.
Function Machines is brand new, so I’d love to hear how you use it and any feedback you might have.
