Students often have difficulty connecting the Cartesian graph of a function to the actual motion of the variables. Their challenge in visualizing and describing covariation (the way y varies as x varies steadily) relates to their understanding of function families: function families are distinguished by the nature of their covariation. A function whose growth rate remains constant … Continue Reading ››
Category Archives: Algebra
Tracing the Sine and Cosine Functions
How might we help students connect the unit-circle representation of trigonometric functions with the graphs of these same functions? Below (and here) is a Web Sketchpad model that gives students the tools to construct the graphs of trigonometric functions by using the unit circle as the driving engine. To get started, … Continue Reading ››
Slope Games Aplenty
Eleven years ago, I wrote a post titled What is All the Fuss About Lines? In it, I discussed the difficulties that students encounter when asked to determine the equation of a line. Faced with formulas for calculating slope, the point-slope form of a line, and the slope-intercept form, students lose … Continue Reading ››
Dynagraphs of Linear Functions
This post provides three interactive examples of dynagraphs–a powerful representation of functions that emphasizes the behavior and relationship of a function’s independent and dependent variables.
A Triple Number Line Model for Visualizing Solutions to Equations
In Algebra 1, I was the king of solving for x. Algebraic manipulation was fun and satisfying, and I was good at it. But my confidence was shaken when I encountered a test question of the variety 4x + 5 = 4x – 3. After subtracting 4x from both sides, I was … Continue Reading ››
The Polar-Cartesian Connection
The Web Sketchpad model below (and here) shows the function f(θ) = 1 – cos 2θ in both Cartesian and polar form. For each graph, the independent variable appears as a red bar that corresponds to a particular value of x (for Cartesian) or θ (for polar). The red bar has … Continue Reading ››
Introducing Web Sketchpad at the 2021 NCTM Annual Meeting
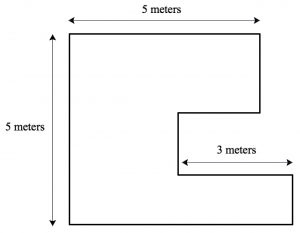
The Perimeter Problem
At a recent meeting of mathematics content coaches (many from the organization Reimagined) we investigated the following problem: What is the perimeter of the polygon below?

It appears at first that there isn't enough information to solve the problem. Indeed, the lengths of only three of the polygon's … Continue Reading ››
Adding and Subtracting Integers
A recent post on an NCTM discussion group asked about tools to help students visualize and understand addition and subtraction of integers. We wanted to make a visualization tool for students that they could use in multiple ways. The result is the Web Sketchpad model below (and here). Page one focuses on addition while … Continue Reading ››