Creating Animated Factorization Diagrams
Last year, I had the pleasure of co-organizing a geometry-focused coaching collaborative led by Metamorphosis, a New York-based organization that offers professional content coaching to transform the mindset and practices of teachers and administrators. I had so much fun that I decided to do it again! My workshop partners were Metamorphosis staffers Toni Cameron, Ariel Dlugasch, and Kara Levin.
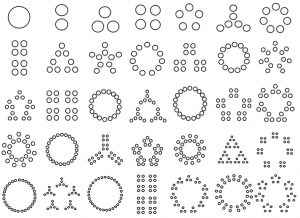
Several days before the workshop, Metamorphosis sent a handout of the picture below to the participating math coaches and asked them to think about the following:
- Write down your noticings and wonderings about the patterns you see.
- What is the math? Can you name any mathematical big ideas?
- How can you use these patterns to make connections between number and geometry?
- How could you use this material in a fifth-grade classroom?
The workshop began with the coaches sharing their insights. Here are just a few of their observations:
- Prime numbers are represented as circles or, in fact, as regular polygons that begin to look more and more circular as the numbers grow larger.
- The images are rich with patterns relating to factors and multiplication that can be revealed by using colored markers to shade the circles.
- The images are subject to much interpretation. For example, 14 can be viewed as two groups of seven (an inner and outer ring of seven) or as seven pairs of two circles.
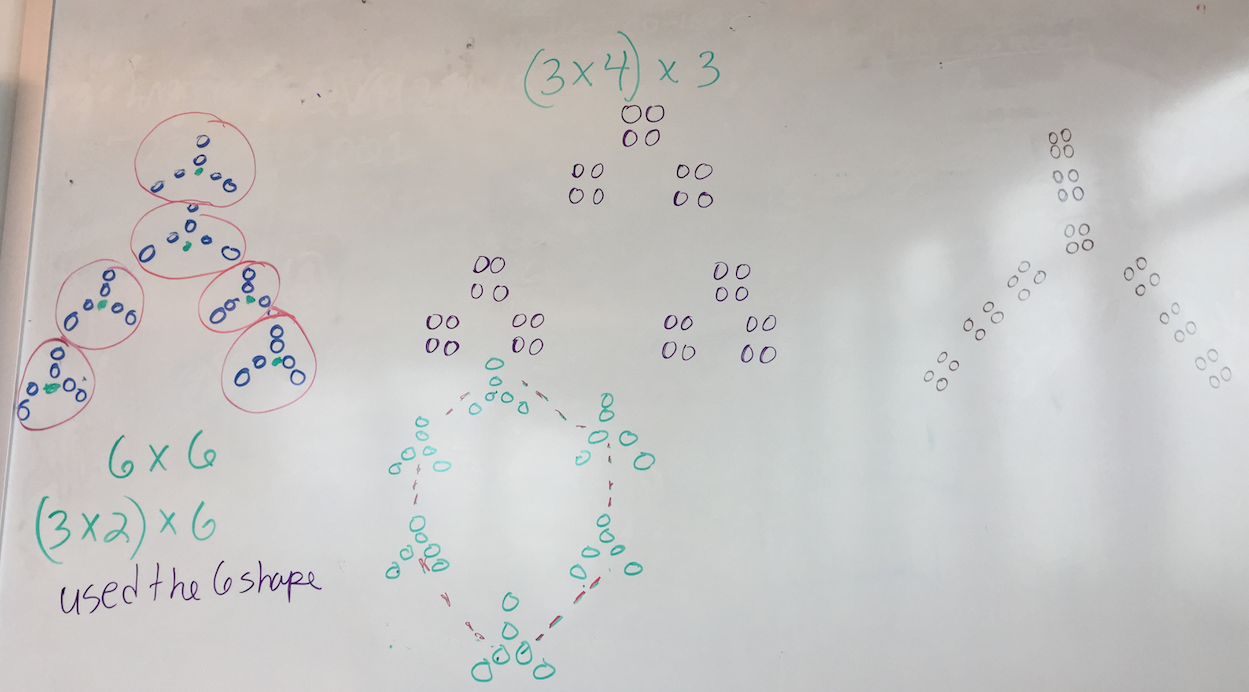
We asked the coaches to draw, share, and justify a visual representation for the number 36 since the handout only displayed the numbers 1 through 35. The coaches’ drawings were varied, and they did a nice job of justifying their arrangement of the circles.
After 45 minutes of discussion, we turned from the static representations of the numbers to two interactive Web Sketchpad versions of the factorization diagrams that I built prior the workshop. My goal was to allow students to build and animate images of their own rather than rely solely on the handout. (These dynamic models appear here and here, along with a short video at the end of this post that explains how they work. I suggest watching the video and experimenting with the models before reading further.)
It was fun to speculate how students might use the dynamic models, but of course the only way to really know was to bring the models into a classroom. Luckily, our coaching collaborative was held at the Battery Park City School in lower Manhattan, so we were able to work with one of its fifth-grade teachers, Francis Laros.
As all of us watched and took notes, Ariel, our Metamorphosis coach, conferred with Francis about how he might use the dynamic models in his classroom (Metamorphosis develops coaching skills by allowing their coaches to watch other coaches in action.) Francis and Ariel decided that they would start with the second of my two dynamic models and give students time to play with it before setting a specific mathematical task.
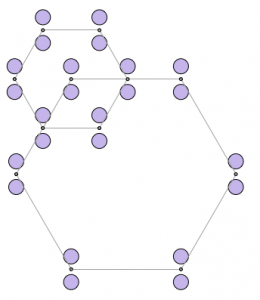
After a brief introduction to the model and some time for open exploration, Francis challenged his students to find multiple ways to create 24 circles. When they were done, students turned to a neighbor and described in words alone how they built their construction. This was a great opportunity for students to use mathematical vocabulary and to practice giving precise directions.
Paul, one of the students in the class, had trouble at first stating his directions but after hearing his partner give directions, was able to fine tune his description; Here’s what he said along with the image we built based on his steps: “The base is a hexagon. There are two circles on all of the vertices. There is another hexagon attached to one of the vertices of the hexagon. There are two circles on all of the vertices of the new hexagon.”
When we asked Paul why he did not simply attach four circles to each of the six vertices of the larger hexagon, he said that he wanted to challenge himself. Paul’s comment provided a satisfying ending to our day.
How might you use these two interactive models with your students?
You can read about the background of factorization diagrams here and view a slide show that displays the factorization diagrams of numbers extending into the hundreds here.
An annotated list of all our elementary-themed blog posts is here.