The Scaled Maps Problem
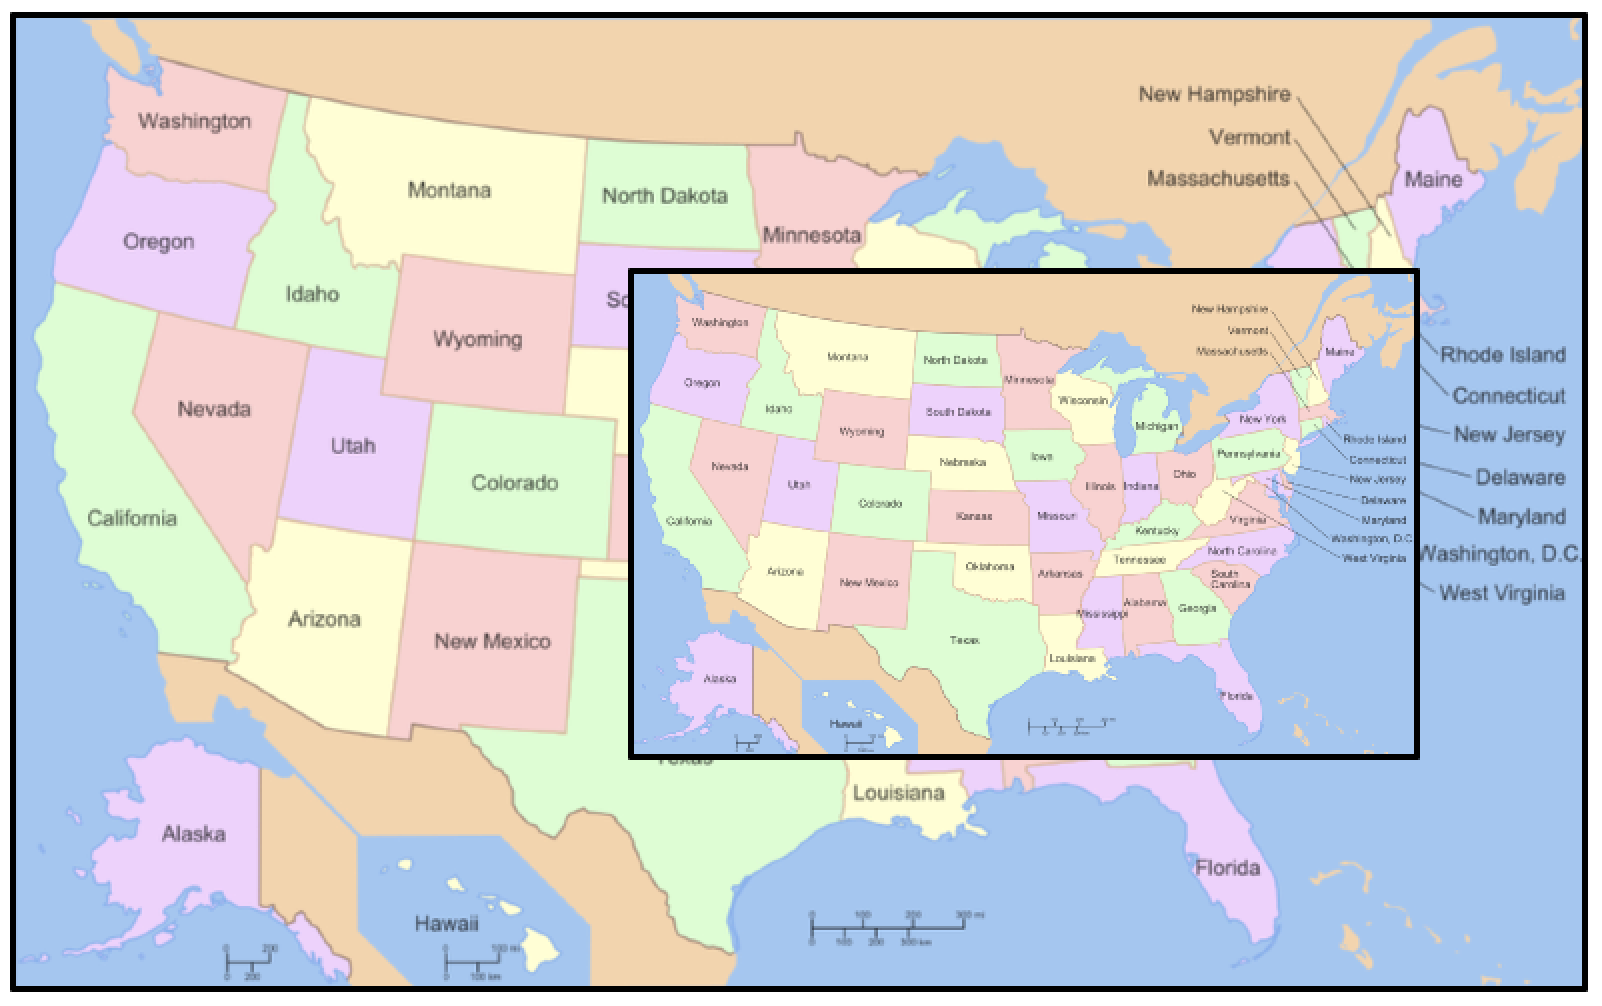
Below are two maps of the United Sates, with the smaller map a 50 percent scaled copy of the original. The edges of the two maps are parallel. Imagine that the maps are printed out, with one resting on top of the other.
Believe it or not, you can stick a pin straight through both maps so that the pin simultaneously pierces the identical geographical location on each one! How can you find this location?
I gave this problem to my NYU pre-service teachers as homework on their first day of the semester, and they surprised me with their diverse approaches for determining the pin’s location. In this post, I summarize their strategies, leaving the specific explanations for your students to expand upon, should you share these approaches with them.
For a pre-service course, I recommend asking teachers to imagine that their own classroom of students devised the methods below. How would they sequence these methods for student-led presentations, and how would they help their class to connect the mathematical threads? These types of considerations are ones addressed in NCTM’s 5 Practices for Orchestrating Productive Mathematics Discussions (Smith & Stein).
Method One
In the interactive Web Sketchpad model below (and here), numbered tick marks have been added to both maps. Experiment by dragging the vertical and horizontal lines. How can you use these lines to determine where to stick the pin? Why does your method work?
Method Two
In the approach below (and here), we keep reducing the map by 50 percent, placing each new scaled copy onto its immediate predecessor so that the position of the two maps mimics the positioning of the original two maps. You can see this idea in action by pressing the Repeated Copies button in the webksetch below. It’s easier, in fact, to view the process with the maps hidden and only their rectangular frames visible. Go to page 2 of the websketch for this less cluttered model.
How does this method help you find the location of the pin and why does it work?
Method Three
The student who devised this method began by proposing a simpler exploration: Start with two blank rectangular sheets of paper, one a 50 percent scaled copy of the other. Mark the centers of the two sheets as M1 and M2. Now arrange the sheets so that their top-left corners align (below left) or the midpoints of their upper edges align (below right). Points A and B represent the pin locations shared by the rectangles for these particular configurations. What do you notice and wonder about the relationship between point A and M1 and M2? And what about the relationship between point B and M1 and M2?
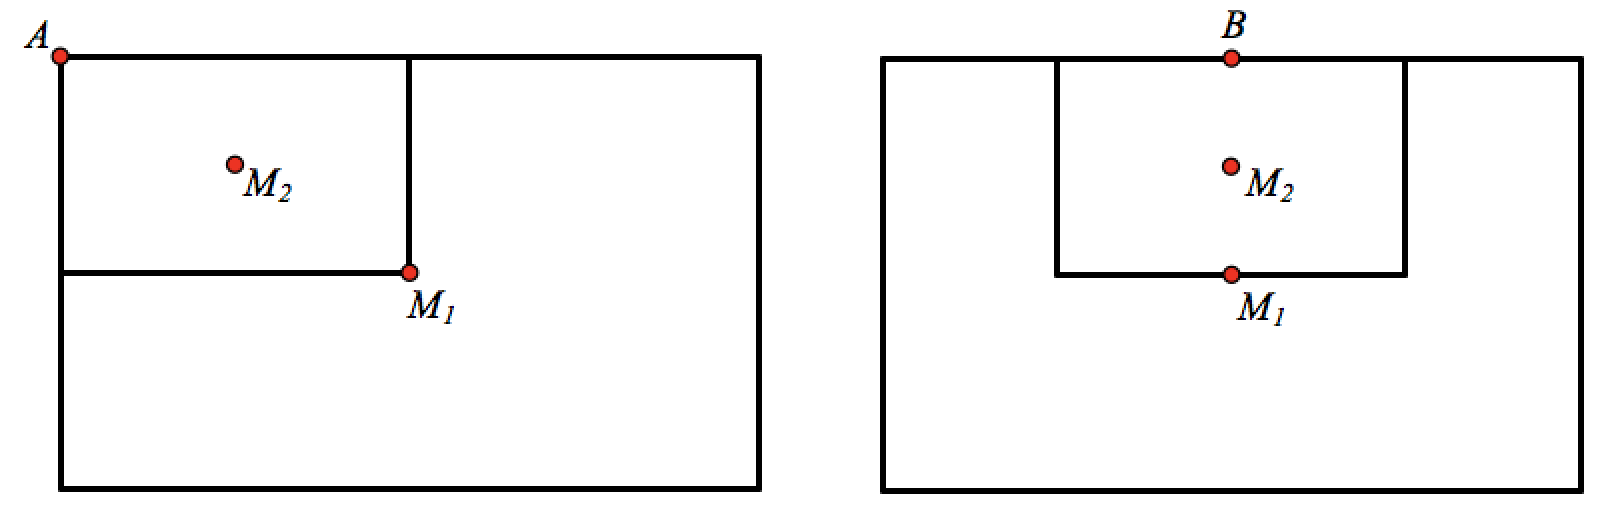
Having examined these special cases, the student returned to the original question. Below (and here), we see the maps with the centers M1 and M2 marked. How can you determine where to place the pin using the segment and its midpoint that sits below the maps? Why does your method work?
Method Four
Below (and here), we’ve added a coordinate system to the maps, with the lower-let corner of the larger map at at the origin. Point C sits at the lower-left corner of the scaled map, and its coordinates are (10.88, 4.09). We’ve created a draggable point P that currently sits somewhere in Arizona. Its coordinates are (5.08, 5.79). How can you use the coordinates of points C and P to compute the location of a point Q that sits at the same location in Arizona as point P, but on the smaller map?
More generally, if point P‘s coordinates are (x, y), what is the location of point Q? And how can you use this information to solve algebraically for the location where points P and Q meet?
If you press the Show Point Q button, you’ll see its location. Drag point P to find the location where points P and Q meet.
Method Five
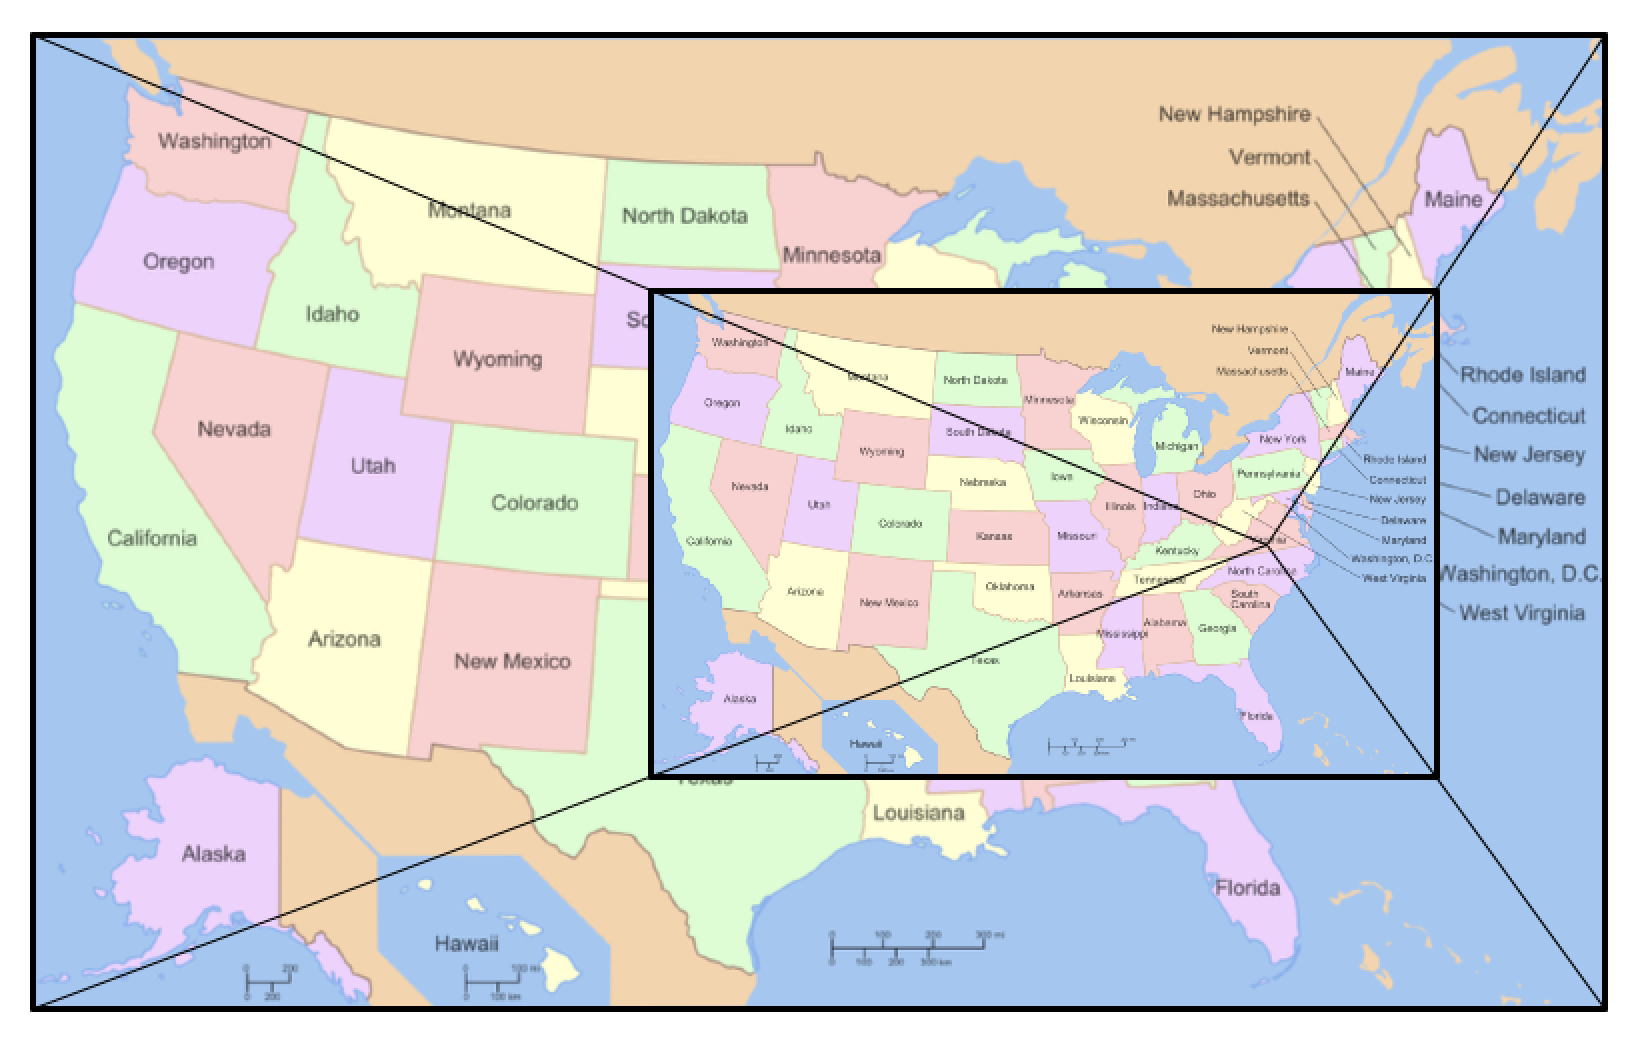
For teachers who knew about dilation, they solved the problem very quickly, realizing that if they identified the center of dilation for the two scaled maps, this would represent the location of the pin. As shown below, the teachers connected the corresponding vertices of the two maps to determine the center of dilation.
I asked teachers who used this approach to think of at least two other methods that a student who had not been introduced to dilation might employ to solve the problem.
Note: The map image in this post is used under the Creative Commons Attribution-Share Alike 3.0 Unported license.